Psychological Levels [UkutaLabs]█ OVERVIEW
The Psychological Levels Indicator provides real-time insight into key price levels within the market that can serve as powerful support and resistance levels. These levels are updated automatically in real time to display only the most relevant levels to the current price, facilitating your trading experience.
The aim of this script is to simplify the trading experience of users by automatically identifying and displaying price levels that they should be aware of.
█ USAGE
On each tick, the nearest key price level is automatically identified by the script. The script will identify this level based on the price of the commodity you are applying it to:
• Commodities priced at $0 to $999.99 will identify the nearest whole dollar.
• Commodities priced at $1,000 to $9,999.99 will identify the nearest $10.
• Commodities priced at $10,000 to $99,999.99 will identify the nearest $100.
• Commodities priced over $100,000 will identify the nearest $1,000.
We refer to this rounding price as the gap price, and it is also used to determine the prices of the other lines drawn by this script.
After identifying the nearest key price level, the script then incrementally draws lines on either side of this level at an interval of the gap price. We refer to these as the Major Lines, and the user can control the number of these lines that get drawn, the style of these lines, and they can be disabled in the settings.
The script then draws lines at the half-way point between each of these Major Lines, and we refer to these as the Minor Lines. Like the Major Lines, the user has full control over the number of these lines that can be drawn, the style of these lines, and they can be disabled in the settings.
█ SETTINGS
Configuration
• Number of Lines: Determines the number of lines that are drawn on either side of the key price line. This controls both the number of Major Lines and Minor Lines.
Line Settings
• Major Lines: Determines whether or not the Major Lines will be displayed.
- Color: Determines the color of Major Lines.
- Style: Determines the style of Major Lines.
- Width: Determines the width of Major Lines
• Minor Lines: Determines whether or not the Minor Lines will be displayed.
- Color: Determines the color of Minor Lines
- Style: Determines the style of Minor Lines
- Width: Determines the width of Minor Lines
Cerca negli script per "the script"

OptiRange | FractalystWhat’s the purpose of this indicator?
This indicator is designed to integrate probabilities with liquidity levels, while also providing a mechanical method for identifying market structure by using Fractals by Williams.
----
How does this indicator identify market structure?
This script identifies breaks of market structure by analyzing candle closures above or below swing levels.
As soon as a candle has closed above or below the initial swing on your charts, the script validates that there is at least one swing preceding the break before confirming it as a structural break.
Once a break is occured then it assigns a numeric ID to the break starting from 1 and draws two extremities: one as liquidity and the other as invalidation (LIQ/INV).
----
What do the extremities show us on the charts?
you'll see two clear extremities on your charts:
1. The first extremity represents the structural liquidity level. (LIQ)
2. The other extremity indicates the level that, if price breaks through it, results in a structural shift to the opposite side. (INV)
----
How does it calculate probabilities?
Each break of market structure, denoted as X, is assigned a unique ID, starting from X1 for the first break, X2 for the second, and so on.
The probabilities are calculated based on breaks holding, meaning price closing through the liquidity level, rather than invalidation. This probability is then divided by the total count of similar numeric breaks.
For example, if 75 out of 100 bullish X1s become X2, then the probability of X1 becoming X2 on your charts will be displayed as 80% in the following format: ⬆ 75%
----
What are the Fractal blocks?
Fractal blocks refer to the most extreme swing candle within the latest break. They can serve as significant levels for price rejection and may guide movements toward the next break, often in confluence with probability analysis for added confirmation.
If the price retraces back to a bullish fractal block, we aim to look for buy/long positions. Conversely, if the price retraces back to a bearish fractal block, we aim to look for sell/short positions.
----
What are mitigations?
Mitigations refer to specific price action occurrences identified by the script:
1- When the price reaches the most recent fractal block and confirms a swing candle, the script automatically draws a line from the swing to the fractal block bar and labels it with a checkmark.
1- If the price wicks through the invalidation level and then retraces back to the fractal block while forming a swing candle, the script labels this as a double mitigation on the chart.
This level will serve as the next potential invalidation level if a break occurs in the same direction.
----
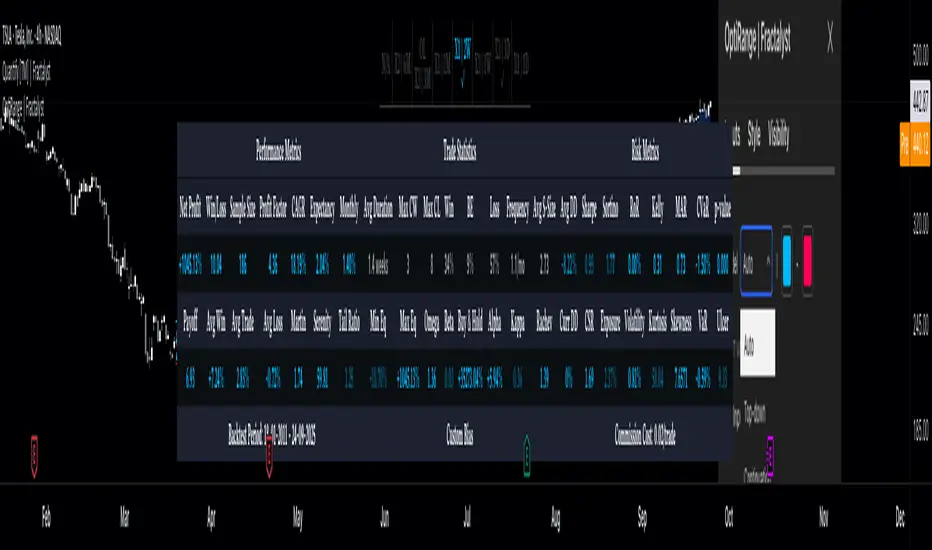
What does the bottom table display?
The bottom table presents numeric breaks across multiple timeframes, with the text color indicating the trend direction. Enabling traders to assess the higher timeframes market trend without needing to switch between timeframes manually.
----
How to use the indicator?
1. Add "OptiRange | Fractalyst" to your TradingView chart.
2. Choose the pair you want to analyze or trade.
3. Start with the 12-month timeframe.
4. Use the table bias with the maximal settings to find the lowest timeframe that’s showing you the mitigation (✓)
5. Confirm that the probability of the current liquidity is higher than 50%.
6. Place your limit order at the Fibonacci level of 0.618 of the mitigation candle.
7. Set your stop-loss at the mitigation level.
8. Determine your take profit based on the liquidity of the current timeframe, or if possible, the liquidity of a higher timeframe in the same direction; otherwise, use the liquidity of the current timeframe.
9. Risk adjustment and Trade management based on your personal preferences.
Example:
----
User-input settings and customizations
----
What makes this indicator original?
- This script leverages Fractals, a fundamental concept in many trading methodologies.
- For a break to be considered valid, price must have at least two swings:
a swing high followed by a swing low for bullish breaks and a swing low follow by a swing high for bearish breaks.
- This means that each swing point is confirmed by the formation of two candles on its left and two candles on its right, totaling 5 candles for each swing high and swing low, thus requiring 10 candles overall. (This strict rule ensures a thorough assessment of market structure before confirming a break.)
- The script assigns a unique numerical ID to each break of structure, starting from 1.
This numbering system enables the script to calculate the probability of the most recent break becoming the next break, while also factoring in the trend direction.
- Additionally, this script provides insights into higher timeframes' break IDs in the bottom/top centre table, keeping traders informed about the overall higher timeframe picture.
- By integrating these methodologies, the script introduces a unique and systematic method for identifying market structure, thereby enhancing its originality in guiding trading decisions.
Terms and Conditions | Disclaimer
Our charting tools are provided for informational and educational purposes only and should not be construed as financial, investment, or trading advice. They are not intended to forecast market movements or offer specific recommendations. Users should understand that past performance does not guarantee future results and should not base financial decisions solely on historical data. By utilizing our charting tools, the buyer acknowledges that neither the seller nor the creator assumes responsibility for decisions made using the information provided. The buyer assumes full responsibility and liability for any actions taken and their consequences, including potential financial losses. Therefore, by purchasing these charting tools, the customer acknowledges that neither the seller nor the creator is liable for any unfavorable outcomes resulting from the development, sale, or use of the products.
The buyer is responsible for canceling their subscription if they no longer wish to continue at the full retail price. Our policy does not include reimbursement, refunds, or chargebacks once the Terms and Conditions are accepted before purchase.
By continuing to use our charting tools, the user acknowledges and accepts the Terms and Conditions outlined in this legal disclaimer.
Century Levels [UkutaLabs]█ OVERVIEW
The Century Levels Indicator provides real-time insight into key price levels within the market that can serve as powerful support and resistance levels. These levels are updated automatically in real time to display only the most relevant levels to the current price, facilitating your trading experience.
The aim of this script is to simplify the trading experience of users by automatically identifying and displaying price levels that they should be aware of.
█ USAGE
On each tick, the nearest key price level is automatically identified by the script. The script will identify this level based on the price of the commodity you are applying it to:
• Commodities priced at $0 to $999.99 will identify the nearest whole dollar.
• Commodities priced at $1'000 to $9'999.99 will identify the nearest $10.
• Commodities priced at $10'000 to $99'999.99 will identify the nearest $100.
• Commodities priced over $1'000'000 will identify the nearest $1000.
We refer to this rounding price as the gap price, and it is also used to determine the prices of the other lines drawn by this script.
After identifying the nearest key price level, the script then incrementally draws lines on either side of this level at an interval of the gap price. We refer to these as the Major Lines, and the user can control the number of these lines that get drawn, the style of these lines, and they can be disabled in the settings.
The script then draws lines at the half-way point between each of these Major Lines, and we refer to these as the Minor Lines. Like the Major Lines, the user has full control over the number of these lines that can be drawn, the style of these lines, and they can be disabled in the settings.
█ SETTINGS
Configuration
• Number of Lines: Determines the number of lines that are drawn on either side of the key price line. This controls both the number of Major Lines and Minor Lines.
Line Settings
• Major Lines: Determines whether or not the Major Lines will be displayed.
- Color: Determines the color of Major Lines.
- Style: Determines the style of Major Lines.
- Width: Determines the width of Major Lines
• Minor Lines: Determines whether or not the Minor Lines will be displayed.
- Color: Determines the color of Minor Lines
- Style: Determines the style of Minor Lines
- Width: Determines the width of Minor Lines
TSF 20What kind of traders/investors are we?
We are trend followers. We look for assets that are outperforming the market. Our scripts are designed to be used on the higher timeframes (weekly/daily) to catch the large moves/trends in the market.
Our scripts have been designed to help you follow the trend in an asset.
What does this script do?
This script is designed to colour candles on a chart based on their position relative to two sets of Bollinger Bands. Here's a breakdown of how it functions:
Bollinger Bands Setup:
The script uses two sets of Bollinger Bands, both with a length of 20 and based on the closing prices of candles.
The first set of Bollinger Bands uses a standard deviation (StdDev) of 1.
The second set uses a standard deviation of 2.
Neither set of bands is displayed on the chart.
Coloring Candles:
Green Candle: A candle is coloured green if its close is above the upper Bollinger Band with StdDev 1 but below the upper Bollinger Band with StdDev 2. This indicates a moderately bullish sentiment.
Dark Green Candle: A candle is colored dark green when its close is above the upper Bollinger Band with StdDev 2. This implies a stronger bullish sentiment.
Red Candle: A candle is coloured red if its close is below the lower Bollinger Band with StdDev 1 but above the lower Bollinger Band with StdDev 2. This indicates a moderately bearish sentiment.
Dark Red Candle: A candle is colored dark red if its close is below the lower Bollinger Band with StdDev 2, indicating a stronger bearish sentiment.
Grey Candle: A candle is coloured grey if it closes between the upper and lower Bollinger Bands with StdDev 1. This usually signifies a neutral market condition or periods of consolidation.
In summary, this script is an analytical tool that visually represents the market's bullishness or bearishness relative to the Bollinger Bands, without displaying the bands themselves. It's designed to help investors quickly assess market conditions and sentiment based on the colour-coded representation of price action in relation to these volatility bands.
What makes this script unique?
Innovative Color-Coding System: Candles are colored in varying shades of green and red, providing an immediate visual cue about the market's bullish or bearish tendencies. A neutral grey is also used, offering a quick assessment of market indecision or consolidation phases.
Dual Bollinger Band Analysis: Utilizes two sets of Bollinger Bands (StdDev 1 and StdDev 2) to gauge market volatility and sentiment. This dual-band approach enhances the precision of sentiment analysis compared to using a single standard deviation.
Customizable and Non-Obtrusive: Designed to keep your charts clean and readable. The Bollinger Bands themselves are not displayed, reducing visual clutter and allowing for a focus on price action.
Versatile and Adaptable: Suitable for various trading styles and timeframes. Whether you are a short-term or long-term investor, this indicator can be seamlessly integrated into your analysis toolkit.
Valuable Addition to Market Analysis: Enhances traditional candlestick analysis and complements other technical indicators and strategies. It offers an additional layer of understanding market dynamics and can be used to confirm or question other signals.
How It Adds Value:
Enhanced Visual Analysis: By colour-coding candles based on Bollinger Band positioning, it simplifies the interpretation of market sentiment and volatility, making it easier to spot trends and reversals.
Strategic Decision Making: Helps traders make more informed decisions by clearly highlighting bullish and bearish strength, or lack thereof, in the market.
Time Efficiency: Reduces the time spent analyzing charts by providing an immediate visual representation of market conditions.
Originality: Offers a fresh perspective and an innovative approach to using Bollinger Bands, making it a unique addition to the community's toolbox.

Day/Week/Month Metrics (Zeiierman)█ Overview
The Day/Week/Month Metrics (Zeiierman) indicator is a powerful tool for traders looking to incorporate historical performance into their trading strategy. It computes statistical metrics related to the performance of a trading instrument on different time scales: daily, weekly, and monthly. Breaking down the performance into daily, weekly, and monthly metrics provides a granular view of the instrument's behavior.
The indicator requires the chart to be set on a daily timeframe.
█ Key Statistics
⚪ Day in month
The performance of financial markets can show variability across different days within a month. This phenomenon, often referred to as the "monthly effect" or "turn-of-the-month effect," suggests that certain days of the month, especially the first and last days, tend to exhibit higher than average returns in many stock markets around the world. This effect is attributed to various factors including payroll contributions, investment of monthly dividends, and psychological factors among traders and investors.
⚪ Edge
The Edge calculation identifies days within a month that consistently outperform the average monthly trading performance. It provides a statistical advantage by quantifying how often trading on these specific days yields better returns than the overall monthly average. This insight helps traders understand not just when returns might be higher, but also how reliable these patterns are over time. By focusing on days with a higher "Edge," traders can potentially increase their chances of success by aligning their strategies with historically more profitable days.
⚪ Month
Historically, the stock market has exhibited seasonal trends, with certain months showing distinct patterns of performance. One of the most well-documented patterns is the "Sell in May and go away" phenomenon, suggesting that the period from November to April has historically brought significantly stronger gains in many major stock indices compared to the period from May to October. This pattern highlights the potential impact of seasonal investor sentiment and activities on market performance.
⚪ Day in week
Various studies have identified the "day-of-the-week effect," where certain days of the week, particularly Monday and Friday, show different average returns compared to other weekdays. Historically, Mondays have been associated with lower or negative average returns in many markets, a phenomenon often linked to the settlement of trades from the previous week and negative news accumulation over the weekend. Fridays, on the other hand, might exhibit positive bias as investors adjust positions ahead of the weekend.
⚪ Week in month
The performance of markets can also vary within different weeks of the month, with some studies suggesting a "week of the month effect." Typically, the first and the last week of the month may show stronger performance compared to the middle weeks. This pattern can be influenced by factors such as the timing of economic reports, monthly investment flows, and options and futures expiration dates which tend to cluster around these periods, affecting investor behavior and market liquidity.
█ How It Works
⚪ Day in Month
For each day of the month (1-31), the script calculates the average percentage change between the opening and closing prices of a trading instrument. This metric helps identify which days have historically been more volatile or profitable.
It uses arrays to store the sum of percentage changes for each day and the total occurrences of each day to calculate the average percentage change.
⚪ Month
The script calculates the overall gain for each month (January-December) by comparing the closing price at the start of a month to the closing price at the end, expressed as a percentage. This metric offers insights into which months might offer better trading opportunities based on historical performance.
Monthly gains are tracked using arrays that store the sum of these gains for each month and the count of occurrences to calculate the average monthly gain.
⚪ Day in Week
Similar to the day in the month analysis, the script evaluates the average percentage change between the opening and closing prices for each day of the week (Monday-Sunday). This information can be used to assess which days of the week are typically more favorable for trading.
The script uses arrays to accumulate percentage changes and occurrences for each weekday, allowing for the calculation of average changes per day of the week.
⚪ Week in Month
The script assesses the performance of each week within a month, identifying the gain from the start to the end of each week, expressed as a percentage. This can help traders understand which weeks within a month may have historically presented better trading conditions.
It employs arrays to track the weekly gains and the number of weeks, using a counter to identify which week of the month it is (1-4), allowing for the calculation of average weekly gains.
█ How to Use
Traders can use this indicator to identify patterns or trends in the instrument's performance. For example, if a particular day of the week consistently shows a higher percentage of bullish closes, a trader might consider this in their strategy. Similarly, if certain months show stronger performance historically, this information could influence trading decisions.
Identifying High-Performance Days and Periods
Day in Month & Day in Week Analysis: By examining the average percentage change for each day of the month and week, traders can identify specific days that historically have shown higher volatility or profitability. This allows for targeted trading strategies, focusing on these high-performance days to maximize potential gains.
Month Analysis: Understanding which months have historically provided better returns enables traders to adjust their trading intensity or capital allocation in anticipation of seasonally stronger or weaker periods.
Week in Month Analysis: Identifying which weeks within a month have historically been more profitable can help traders plan their trades around these periods, potentially increasing their chances of success.
█ Settings
Enable or disable the types of statistics you want to display in the table.
Table Size: Users can select the size of the table displayed on the chart, ranging from "Tiny" to "Auto," which adjusts based on screen size.
Table Position: Users can choose the location of the table on the chart
-----------------
Disclaimer
The information contained in my Scripts/Indicators/Ideas/Algos/Systems does not constitute financial advice or a solicitation to buy or sell any securities of any type. I will not accept liability for any loss or damage, including without limitation any loss of profit, which may arise directly or indirectly from the use of or reliance on such information.
All investments involve risk, and the past performance of a security, industry, sector, market, financial product, trading strategy, backtest, or individual's trading does not guarantee future results or returns. Investors are fully responsible for any investment decisions they make. Such decisions should be based solely on an evaluation of their financial circumstances, investment objectives, risk tolerance, and liquidity needs.
My Scripts/Indicators/Ideas/Algos/Systems are only for educational purposes!

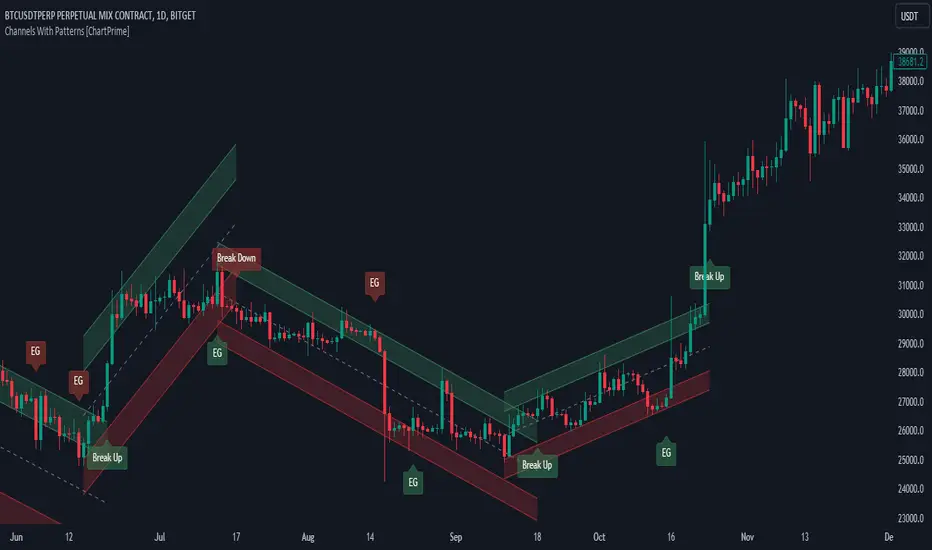
Channels With Patterns [ChartPrime]The Channels With Patterns indicator is an attempt at minimizing the delay in forming a trend channel. This indicator uses a single pivot in conjunction with a smooth version of the price to estimate the direction of an emerging trend. Using ATR, this indicator estimates the volatility of the new trend by adjusting the channel size by a multiple of the current ATR.
One of the biggest complains for any trend indicator is that it takes too long to create a channel or trend line. This indicator estimates the trend channel by checking if the price is moving in the correct direction and then it projects the channel from a single pivot. To allow for some margin of error, this script uses an offset to help center the channel.
This offset is generated from the ATR at the time of formation. In conjunction with forming estimated trend channels, this indicator features select candle stick patterns. These candle stick patterns are filtered by location in the formed trend channel. If the price is within an extremity of the trend channel it will appear. Filtering classical vanilla candle stick patterns using this methodology can result in some interesting results and possible confluence points for traders. For example; a bearish hammer appearing when filtered in an upper zone might add an extra level of realtime unique confluence traders.
Traders can use this script as a general trend line indicator that is a bit more forward looking than others, or it can be used it as its full blown trend channel estimator. Due to the fact that this is an estimate using the minimum possible information to make the channel, its accuracy will not always be perfect and can suffer compared to alternative methods.
When configuring the indicator it is important to understand the role of each input. Here is a description of all of the settings provided:
Presets (`preset`): This input allows users to quickly configure the indicator based on the market they are trading in. Selecting "Stocks," "Forex," or "Crypto" automatically adjusts various parameters to settings deemed optimal for these markets. The "User" option lets traders manually configure settings for a more personalized approach.
Style (`style`): This setting determines how pivot points are calculated. "Wick" uses the high and low of candlesticks (including wicks), which can be more sensitive to market extremes. "Body" uses only the open and close prices (the body of the candlesticks), potentially offering a more stable pivot point calculation.
Break Style (`break_style`): This option defines what price is used to determine if a channel has been broken. "Close" uses the closing price of a candlestick, while "High/Low" uses the highest and lowest prices. This affects how channel breaks are identified and can influence trading signals.
Instant Mode (`instant`): When enabled, this feature allows the indicator to form channels more quickly by initiating them as soon as potential formations are detected. This can provide earlier signals but may increase the risk of false positives.
ATR Length (`atr_length`): This input sets the period for the Average True Range (ATR), a common volatility indicator. A longer ATR period may smooth out the channel but could delay responsiveness to market changes. A shorter period might make the channel more responsive but potentially more erratic.
Offset Center (`offset`): Adjusts the vertical positioning of the channel. This can help in aligning the channel more accurately with the price action, depending on market conditions and personal trading strategies.
Size (`atr_multiplier`): Alters the channel's size relative to the ATR. A higher multiplier makes a wider channel, which might be useful in more volatile markets. A lower multiplier tightens the channel, which could be better for less volatile conditions.
Padding % (`padding`): This setting adjusts the padding within the top and bottom quarters of the channel. It essentially fine-tunes the channel's sensitivity to price movements near its boundaries.
Pivot Length (`pivot_length`): Determines the number of bars used to calculate pivot points. A longer length may provide more significant pivot points but can reduce the number of channels formed.
Pivot Look Forward (`look_forward`): Sets the number of bars to look forward in the pivot calculation, affecting how quickly the channel adapts to new pivots.
Average H/L Length (`avg_length`): Controls the smoothing of the high and low prices used in the channel calculation. A longer average length can lead to smoother, more gradual channel slopes.
Enable Hammer (`enable_hammer`): When enabled, the indicator will highlight Hammer candlestick patterns, which are often considered bullish reversal indicators.
Enable Inverted Hammer (`enable_ihammer`): This toggles the display of Inverted Hammer patterns, typically viewed as potential bullish reversal signals.
Enable Bullish Engulfing (`enable_bullish_engulfing`): Enables the identification of Bullish Engulfing patterns, another type of bullish reversal indicator.
Enable Bearish Engulfing (`enable_bearish_engulfing`): When activated, this highlights Bearish Engulfing patterns, which are often interpreted as bearish reversal signals.
Extend Channel (`extend`): This option, when enabled, extends the drawn channels forward until they are either broken or a new channel is formed.
Show Break Label (`show_break_label`): Toggles the display of labels indicating where the channel has been broken, providing visual cues for potential trade entries or exits.
Channel History Length (`history_length`): Determines how many historical channels are displayed on the chart. This can be useful for analyzing past performance and patterns.
Channel Colors (`top_color`, `bottom_color`, `center_color`): These settings allow customization of the channel's appearance by setting the colors of the top, bottom, and center lines.
Line Transparency (`line_trans`): Adjusts the transparency of the channel lines, helping to balance visibility with chart readability.
Center Line Transparency (`center_trans`): Specifically sets the transparency level of the center line of the channel.
Channel Fill Transparency (`fill_trans`): Modifies the transparency of the filled areas between the channel lines, which can enhance chart clarity and focus on the price action.
Break Colors (`break_up_color`, `break_down_color`): Sets the colors for labels that appear when the channel is broken, either upwards or downwards.
Break Label Text Color (`text_color`): Determines the color of the text in the break labels, enhancing readability based on the chart's background and color scheme.
Candle Pattern Colors (`h_color`, `ih_color`, `bullish_engulfing_color`, `bearish_engulfing_color`): These inputs allow for the customization of the colors used to highlight various candle patterns on the chart.
Candle Pattern Text Color (`candle_text_color`): Sets the color of the text for labels associated with candle pattern indicators.
Alerts (`new_channel_alert`, `break_alert`, `hammer_alert`, `ihammer_alert`, `bullish_engulfing_alert`, `bearish_engulfing_alert`): These toggles enable or disable alerts for different events, such as the formation of new channels, channel breaks, or the appearance of specific candle patterns. This feature is crucial for traders who rely on timely notifications for potential trading opportunities.
We have provided a few presets to allow you to get a feeling for how the indicator works with different settings easily. Here is a description of the settings used in each preset:
Stocks Preset:
Style: "Wick"
Break Style: False (High/Low)
Instant Mode: True
ATR Length: 10
Size (ATR Multiplier): 4
Pivot Length: 10
Pivot Look Forward: 15
Average H/L Length: 18
Forex Preset:
Style: "Wick"
Break Style: False (High/Low)
Instant Mode: True
ATR Length: 100
Size (ATR Multiplier): 5
Pivot Length: 10
Pivot Look Forward: 15
Average H/L Length: 18
Crypto Preset:
Style: "Wick"
Break Style: False (High/Low)
Instant Mode: True
ATR Length: 10
Size (ATR Multiplier): 4
Pivot Length: 10
Pivot Look Forward: 15
Average H/L Length: 18
This script first starts by defining and collecting the relevant data for the main body of the code with data(). This generates the pivot data, the levels, the ranges, the averages, the deltas, and finally the candle sticks. Once there is a higher low, or lower high detected via the pivots and the current price it triggers the formation of the new channel. It takes the delta between the last pivot and the current average price and projects the trend channel using this delta. If the price exceeds the extremities of the channel it will classify this as a break from the estimated structure and begin looking for a new channel. The idea is that when trending, the price will oscillate between extremities as defined by a range and direction. If the price is inside of one of these extremities the script will look for candle stick patterns. This is how the script operates.
On a more technical level, this script is meant to showcase Pine Script's custom types and methods. We have made use of a properties pattern allows functions to use a minimal number of arguments. This allows you to add new inputs without modifying a string of functions. The use of methods and data structures allows the main body of the code to be easy to understand and for the script as a whole to be easily modified. We have made sure that the script is modular so that users can incorporate this into their own custom scripts. It should be easy to expand on this script as the main logic is fairly compact and open for easy modification. All features are packed into their own function for easy use elsewhere. This is particularly evident in the candle stick section. I have simplified the process of creating candle stick patterns by creating a type. All users have to do is make methods for this type.
candle()=>
polarity = open < close
body_top = math.max(open, close)
body_bottom = math.min(open, close)
body_range = body_top - body_bottom
top_wick = high - body_top
bottom_wick = body_bottom - low
average_body = ta.ema(body_range, 14)
average_top_wick = ta.ema(top_wick, 14)
average_bottom_wick = ta.ema(bottom_wick, 14)
has_body = body_range != 0
has_top_wick = top_wick != 0
has_bottom_wick = bottom_wick != 0
above_average_body = body_range > average_body
above_average_top_wick = top_wick > average_top_wick
above_average_bottom_wick = bottom_wick > average_bottom_wick
candle_data.new(
polarity
, body_top
, body_bottom
, body_range
, top_wick
, bottom_wick
, average_body
, average_top_wick
, average_bottom_wick
, has_body
, has_top_wick
, has_bottom_wick
, above_average_body
, above_average_top_wick
, above_average_bottom_wick
)
In conclusion, this script offers a blend of rapid trend channel formation and candlestick pattern recognition, making it a unique tool for traders looking for a more proactive approach to trend analysis.
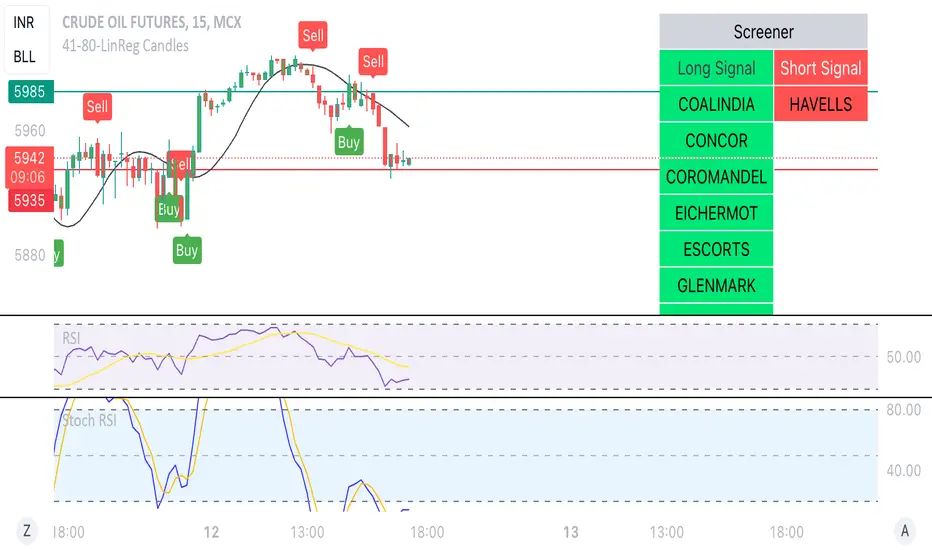
Linear Reg CandlesThe provided Pine Script is a TradingView script for creating a technical analysis indicator called "Humble LinReg Candles." This script includes features such as linear regression for open, high, low, and close prices, signal smoothing with simple or exponential moving averages, and a trailing stop based on Average True Range (ATR). Additionally, the script contains a screener section to display signals for a list of specified symbols.
Here is a breakdown of the script:
Indicator Settings:
It defines various input parameters such as signal smoothing length, linear regression settings, and options for using simple moving averages.
Linear regression is applied to open, high, low, and close prices based on user-defined settings.
ATR Trailing Stop:
It calculates the Average True Range (ATR) and uses it to determine a trailing stop for buy and sell signals.
Signals are generated based on whether the close price is above or below the ATR trailing stop.
Plotting:
The script plots the calculated signal on the chart using the plot function.
Buy and Sell Conditions:
Buy and sell conditions are defined based on the relationship between the close price and the ATR trailing stop.
Plot shapes and bar colors are used to visually represent buy and sell signals on the chart.
Alerts:
Alerts are triggered when buy or sell conditions are met.
Screener Section:
The script defines a screener section to display a watchlist of symbols with long and short signals.
The watchlist includes a set of predefined symbols with corresponding long and short signals.
Table Theme Settings:
The script allows customization of the table theme, including background color, frame color, and text color.
The size and location of the table on the chart can also be customized.
Screener Function:
A function getSignal is defined to determine long and short signals for each symbol in the watchlist.
The getSym function is used to extract the symbol name from the symbol string.
Dashboard Creation:
The script creates a table (dashboard) to display long and short signals for the symbols in the watchlist.
The table includes headers for "Long Signal" and "Short Signal" and lists the symbols with corresponding signals.
Overall, the script combines technical analysis indicators and a screener to help traders identify potential buy and sell signals for a set of specified symbols.
Kiss Of DeathThis Pine Script code is designed to create a technical indicator on a TradingView chart known as the "Kiss of Death" signal. Here's a description of the script:
The script begins by specifying that it is intended for use with Pine Script version 5 (//@version=5) and sets the indicator's title to "Kiss of Death Signal" with indicator(title="Kiss of Death Signal", overlay=true).
The code calculates a 21-period Exponential Moving Average (EMA) of the closing prices (ema21 = ta.ema(close, 21)). The EMA is a commonly used trend-following indicator.
It also determines the lowest low of the previous two periods (prev_low = ta.lowest(low, 2)). This variable will be used in the signal condition.
The script then defines the signal condition for the "Kiss of Death" pattern. This pattern occurs when:
The current closing price is below the 21-period EMA (close < ema21).
The previous closing price is above or equal to the 21-period EMA (close >= ema21).
The current low is below the lowest low of the previous two periods (low < prev_low).
Next, it uses plot to display the 21-period EMA on the chart (plot(ema21, color=color.blue, title="21 EMA")), using a blue color.
Finally, the script utilizes plotshape to mark the points on the chart where the "Kiss of Death" signal condition is met. It places a red, downward-pointing triangle above the corresponding bars
In summary, this script provides a visual representation of the "Kiss of Death" signal on a TradingView chart, helping traders identify potential bearish reversal points based on the defined conditions. The 21-period EMA is also displayed to provide additional context.
What makes this script unique is that it specifically identifies and visualizes a specific technical pattern known as the "Kiss of Death". The "Kiss of Death" is a bearish reversal pattern that occurs when the current price falls below a specific moving average (in this case, a 21-period Exponential Moving Average or EMA) after previously being above it, and when the current low is below the lowest low of the previous two periods.
This script stands out because it provides a clear and visual representation of this particular pattern on a TradingView chart. By using a red, downward-pointing triangle above the bars, it helps traders quickly identify potential bearish reversal points based on the defined conditions.
The combination of a specific pattern, in this case the "Kiss of Death", along with a visual indicator, sets this script apart and makes it a useful tool for traders looking to identify potential bearish reversal points in their technical analysis.

Gap Statistics (Zeiierman)█ Overview
The Gap Statistics (Zeiierman) indicator is crafted to monitor, analyze, and visually present price gaps on a trading chart. Price gaps are areas on a chart where the price jumps up or down from the previous close to the next open, creating a "gap" in the normal price pattern. This script delivers an extensive range of statistics related to these gaps, encompassing their size, direction (whether bullish or bearish), frequency of getting filled, as well as the average number of bars it takes for a gap to be filled. The indicator also visually represents the gaps, making it easier for traders to spot and analyze them.
█ How It Works
Gap Identification: The script identifies gaps by comparing the open price of a bar to the close price of the previous bar. If there is a discrepancy between the two, it is recognized as a gap.
Gap Classification: Once a gap is identified, it is classified based on its size (as a percentage of the previous close price) and direction (bullish or bearish). The gap is then added to a specific category based on its size.
Gap Tracking: The script keeps track of all identified gaps using arrays and user-defined types, storing details like their size, direction, and whether they have been filled.
Gap Filling: The script continuously monitors the price to check if any previously identified gaps get filled. A gap is considered filled if the price moves back into the gap area.
Statistics and Alerts: The script calculates various statistics like the total number of gaps, the number of filled gaps, the average number of bars it takes for a gap to fill, and the percentage of gaps that get filled. It also generates alerts when a new gap is identified or an existing gap gets filled.
█ How to Use
Gaps are often classified into four main types:
Common Gaps: These are not associated with any major news and are likely to get filled quickly.
Breakaway Gaps: These occur at the end of a price pattern and signal the beginning of a new trend.
Runaway Gaps: Also known as continuation gaps, these occur in the middle of a trend and signal a surge in interest in the stock.
Exhaustion Gaps: These occur near the end of a price pattern and signal a final attempt to hit new highs or lows.
The Gap Statistics (Zeiierman) indicator enhances a trader's ability to use gaps in their trading strategy in several ways:
Statistical Analysis: Traders get comprehensive statistics on gaps, such as their size, direction, and how often they get filled.
Performance Tracking: The indicator tracks how many bars it typically takes for a gap to fill, providing traders with an average timeframe for gap closure.
█ Settings
Display Gaps: Choose to display "All Gaps," "Active Gaps," or "None."
Show Gap Size: Toggle on/off the display of the gap size.
-----------------
Disclaimer
The information contained in my Scripts/Indicators/Ideas/Algos/Systems does not constitute financial advice or a solicitation to buy or sell any securities of any type. I will not accept liability for any loss or damage, including without limitation any loss of profit, which may arise directly or indirectly from the use of or reliance on such information.
All investments involve risk, and the past performance of a security, industry, sector, market, financial product, trading strategy, backtest, or individual's trading does not guarantee future results or returns. Investors are fully responsible for any investment decisions they make. Such decisions should be based solely on an evaluation of their financial circumstances, investment objectives, risk tolerance, and liquidity needs.
My Scripts/Indicators/Ideas/Algos/Systems are only for educational purposes!

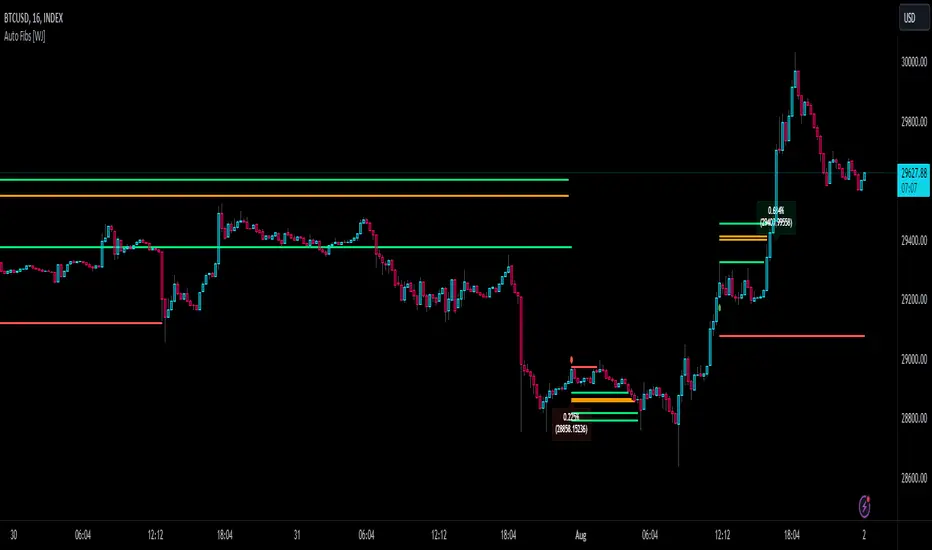
Auto Fibonacci TP Levels [WJ]This script automatically draws Fibonacci levels on a trading chart which are popular tools for traders seeking to identify potential areas of support and resistance.
Here are the features and benefits of this script:
1. Versatility in Sourcing Trade Entries:
Trade source can be customized to either longs (buying trades) or shorts (selling trades). The user has the flexibility to adjust their entry points based on their trading strategy.
Up to 2 sources can be used, expand if you wish.
As it is coded now, the source you have to pick from has to have a 'plot' that sends a (long) or (short) and is equal to 1 and 2 respectively.
Example: In the script you want to use for Long and Shorts, make a plot like this:
plot(LONG ? 1 : SHORT ? 2 : 0, title = "⭐ Outbound signal", display = display.none, editable = false)
The variable name of the LONG and SHORT needs to be the same as the one your code is using to indicate those trades.
2. Flexible Fibonacci Start Points:
The starting points for drawing Fibonacci levels can be customized for both longs and shorts.
3. Configurable Historical Data Length:
Users can adjust the number of historical bars to analyze for calculating higher highs (HH) and lower lows (LL).
4. Informative Labels and Lines:
The script can be configured to show the distance from the entry point to the 0.618 Fibonacci level (the so-called "golden ratio"). This helps traders to visualize the risk-reward ratio of their trades.
It indicates when a Fibonacci level was crossed which could signal a potential reversal.
It allows users to display the golden pocket levels only (0.618 and 0.65) or all the Fibonacci levels.
5. Customizable Fibonacci Levels and Colors:
Users can define their preferred Fibonacci levels and assign specific colors to each of these levels. This helps in identifying different levels quickly and intuitively.
The script also includes functionality for setting stop loss levels for short and long positions, which helps in risk management.
6. Clear Visualization of Crossing Levels:
If a trade crosses a specific Fibonacci level, the script draws lines indicating the crossing. This can help traders to identify potential breakout or reversal points.
7. Calculation of Fibonacci Boxes:
For each Fibonacci level, the script creates a box that indicates the level's range on the chart. This visual aid can help traders to better understand the price movement within these levels.
8. Customizable Labels:
The script provides percentage difference labels at each Fibonacci level, displaying the difference between the price at that level and the price at the 0 Fibonacci level. This can help users quickly understand the price change in terms of percentage at each level.
9. Performance Efficiency:
The script uses arrays to store and manage the Fibonacci levels and their associated colors. This approach enhances the performance of the script, especially when processing a large amount of data.
10. Adaptability:
This script automatically adapts to market movements. When the price crosses a level, it identifies and records this event, aiding the trader's decision-making process.
Overall, this script is highly customizable, adaptable and provides a clear visual representation of important trading data, making it an effective tool for traders using Fibonacci levels in their strategies.
NOTE: If you can't see the fib lines, it is because they have already been triggered/touched by a candle and they are set to not continue after they are touched.
Price based concepts / quantifytools- Overview
Price based concepts incorporates a collection of multiple price action based concepts. Main component of the script is market structure, on top of which liquidity sweeps and deviations are built on, leaving imbalances the only standalone concept included. Each concept can be enabled/disabled separately for creating a selection of indications that one deems relevant for their purposes. Price based concepts are quantified using metrics that measure their expected behavior, such as historical likelihood of supportive price action for given market structure state and volume traded at liquidity sweeps. The concepts principally work on any chart, whether that is equities, currencies, cryptocurrencies or commodities, charts with volume data or no volume data. Essentially any asset that can be considered an ordinary speculative asset. The concepts also work on any timeframe, from second charts to monthly charts. None of the indications are repainted.
Market structure
Market structure is an analysis of support/resistance levels (pivots) and their position relative to each other. Market structure is considered to be bullish on a series of higher highs/higher lows and bearish on a series of lower highs/lower lows. Market structure shifts from bullish to bearish and vice versa on a break of the most recent pivot high/low, indicating weak ability to defend a key level from the dominating side. Supportive market structure typically provides lengthier and sustained trending environment, making it an ideal point of confluence for establishing directional bias for trades.
Liquidity sweeps
Liquidity sweeps are formed when price exceeds a pivot level that served as a provable level of demand once and is expected to display demand again when revisited. A simple way to look at liquidity sweeps is re-tests of untapped support/resistance levels.
Deviations
Deviations are formed when price exceeds a reference level (market structure shift level/liquidity sweep level) and shortly closes back in, leaving participating breakout traders in an awkward position. On further adverse movement, stuck breakout traders are forced to cover their underwater positions, creating ideal conditions for a lengthier reversal.
Imbalances
Imbalances, also known as fair value gaps or single prints, depict areas of inefficient and one sided transacting. Given inclination for markets to trade efficiently, price is naturally attracted to areas that lack proper participation, making imbalances ideal targets for entries or exits.
Key takeaways
- Price based concepts consists of market structure, liquidity sweeps, deviations and imbalances.
- Market structure shifts from bullish to bearish and vice versa on a break of the most recent pivot high/low, indicating weak ability to defend a key level from the dominating side.
- Supportive market structure tends to provide lengthier and sustained movement for the dominating side, making it an ideal foundation for establishing directional bias for trades.
- Liquidity sweeps are formed when price exceeds an untapped support/resistance level that served as a provable level of demand in the past, likely to show demand again when revisited.
- Deviations are formed when price exceeds a key level and shortly closes back in, leaving breakout traders in an awkward position. Further adverse movement compels trapped participants to cover their positions, creating ideal conditions for a reversal.
- Imbalances depict areas of inefficient and one sided transacting where price is naturally attracted to, making them ideal targets for entries or exits.
- Price based concepts are quantified using metrics that measure expected behavior, such as historical likelihood of supportive structure and volume traded at liquidity sweeps.
- For practical guide with practical examples, see last section.
Accessing script 🔑
See "Author's instructions" section, found at bottom of the script page.
Disclaimer
Price based concepts are not buy/sell signals, a standalone trading strategy or financial advice. They also do not substitute knowing how to trade. Example charts and ideas shown for use cases are textbook examples under ideal conditions, not guaranteed to repeat as they are presented. Price based concepts notify when a set of conditions are in place from a purely technical standpoint. Price based concepts should be viewed as one tool providing one kind of evidence, to be used in conjunction with other means of analysis.
Price based concepts are backtested using metrics that reasonably depict their expected behaviour, such as historical likelihood of supportive price movement on each market structure state. The metrics are not intended to be elaborate and perfect, but to serve as a general barometer for feedback created by the indications. Backtesting is done first and foremost to exclude scenarios where the concepts clearly don't work or work suboptimally, in which case they can't be considered as valid evidence. Even when the metrics indicate historical reactions of good quality, price impact can and inevitably does deviate from the expected. Past results do not guarantee future performance.
- Example charts
Chart #1 : BTCUSDT
Chart #2 : EURUSD
Chart #3 : ES futures
Chart #4 : NG futures
Chart #5 : Custom timeframes
- Concepts
Market structure
Knowing when price has truly pivoted is much harder than it might seem at first. In this script, pivots are determined using a custom formula based on volatility adjusted average price, a fundamentally different approach to the widely used highest/lowest price within X amount of bars. The script calculates average price within set period and adjusts it to volatility. Using this formula, the script determines when price has turned significantly enough and aggressively enough to constitute a relevant pivot, resulting in high accuracy while ruling out subjective decision making completely. Users can adjust length of market structure basis and sensitivity of volatility adjustment to achieve desired magnitude of pivots, reflected on the average swing metrics. Note that structure pivots are backpainted. Typical confirmation time for a pivot is within 2-3 bars after peak in price.
Market structure shifts
Generally speaking, traders consider market structure to have shifted when most recent structure high/low gets taken out, flipping underlying bias from one side over to the other (e.g. from bullish structure favoring upside to bearish structure favoring downside). However, there are many ways to approach the concept and the most popular method might not always be the best one. Users can determine their own market structure shift rules by choosing source (close, high, low, ohlc4 etc.) for determining structure shift. Users can also choose additional rules for structure shift, such as two consecutive closes above/below pivot to qualify as a valid shift.
Liquidity sweeps
Users can set maximum amount of bars liquidity levels are considered relevant from the moment of confirmed pivot. By default liquidity levels are monitored for 250 bars and then discarded. Level of tolerance can be set to anything between 100 and 1000 bars. For each liquidity sweep, relative volume (volume relative to volume moving average) is stored and added to average calculations for keeping track of typical depth of liquidity found at sweeps.
Deviations
Users can set a maximum amount of bars price has to spend above/below reference level to consider a deviation to be in place. By default set to 6 bars.
Imbalances
Users can set a desired fill point for imbalances using the following options: 100%, 75%, 50%, 25%. Users can also opt for excluding insignificant imbalances to attain better relevance in indications.
- Backtesting
Built-in backtesting is based on metrics that are considered to reasonably quantify expected behaviour of the main concept, market structure. Structure feedback is monitored using two metrics, supportive structure and structure period gain. Rest of the metrics provided are informational in nature, such as average swing and average relative volume traded at liquidity sweeps. Main purpose of the metrics is to form a general barometer for monitoring whether or not the concepts can be viewed as valid evidence. When the concepts are clearly not working optimally, one should adjust expectations accordingly or take action to improve performance. To make any valid conclusions of performance, sample size should also be significant enough to eliminate randomness effectively. If sample size on any individual chart is insufficient, one should view feedback scores on multiple correlating and comparable charts to make up for the loss.
For more elaborate backtesting, price based concepts can be used in any other script that has a source input, including fully mechanic strategies utilizing Tradingview's native backtester. Each concept and their indications (e.g. higher low on a bearish structure, lower high on a bullish structure, market structure shift up, imbalance filled etc.) can be utilized separately and used as a component in a backtesting script of your choice.
Structure feedback
Structure feedback is monitored using two metrics, likelihood of supportive price movement following a market structure shift and average structure period gain. If either of the two employed tests indicate failed reactions beyond a tolerable level, one should take action to improve feedback by adjusting the settings. If feedback metrics after adjusting the settings are still insufficient, the concepts are working suboptimally for the given chart and cannot be regarded as valid technical evidence as they are.
Metric #1 : Supportive structure
Each structure pivot is benchmarked against its respective structure shift level. Feedback is considered successful if structure pivot takes place above market structure shift level (in the case of bullish structure) or below market structure shift level (in the case of bearish structure). Structure feedback constitutes as one test indicating how often a market structure state results in price movement that can be considered supportive.
Metric #2 : Structure period gain
Each structure period is expected to present favorable appreciation, measured from one market structure shift level to another. E.g. bullish structure period gain is measured from market structure shift up level to market structure shift down level that ends the bullish structure period. Bearish structure is measured in a vice versa manner, from market structure shift down level to market structure shift up level that ends the bearish structure period. Feedback is considered successful if average structure period gain is supportive for a given structure (positive for bullish structure, negative for bearish structure).
Additional metrics
On top of structure feedback metrics, percentage gain for each swing (distance between a pivot to previous pivot) is recorded and stored to average calculations. Average swing calculations shed light on typical pivot magnitude for better understanding changes made in market structure settings. Average relative volume traded at liquidity sweep on the other hand gives a clue of depth of liquidity typically found on a sweeps.
Feedback scores
When market structure (basis for most concepts) is working optimally, quality threshold for both feedback metrics are met. By default, threshold for supportive structure is set to 66%, indicating valid feedback on 2/3 of backtesting periods on average. On top, average structure period gain needs to be positive (for bullish structures) and negative (for bearish structure) to qualify as valid feedback. When both tests are passed, a tick indicating valid feedback will appear next to feedback scores, otherwise an exclamation mark indicating suboptimal performance on either or both. If both or either test fail, market structure parameters need to be optimized for better performance or one needs to adjust expectations accordingly.
Verifying backtest calculations
Backtest metrics can be toggled on via input menu, separately for bullish and bearish structure. When toggled on, both cumulative and average counters used in backtesting will appear on "Data Window" tab. Calculation states are shown at a point in time where cursor is hovered. E.g. when hovering cursor on 4th of January 2021, backtest calculations as they were during this date will be shown.
- Alerts
Available alerts are the following.
- HH/HL/LH/LL/EQL/EQH on a bullish/bearish structure
- Bullish/bearish market structure shift
- Bullish/bearish imbalance created
- Bullish/bearish imbalance filled
- Bullish/bearish liquidity sweep
- Bullish/bearish deviation
- Visuals
Each concept can be enabled/disabled separately for creating a selection indications that one deems relevant for their purposes. On top, each concept has a stealth visual option for more discreet visuals.
Unfilled imbalances and untapped liquidity levels can be extended forward to better gauge key areas of interest.
Liquidity sweeps have an intensity option, using color and width to visualize volume traded at sweep.
Market structure states and market structure shifts can be visualized as chart color.
Metric table can be offsetted horizontally or vertically from any four corners of the chart, allowing space for tables from other scripts.
Table sizes, label sizes and colors are fully customizable via input menu.
- Practical guide
The basic idea behind market structure is that a side (bulls or bears) have shown significant weakness on a failed attempt to defend a key level (most recent pivot high/low). In the same way, a side has shown significant strength on a successful attempt to break through a key level. This successful break through a key level often leads to sustained lengthier movement for the side that provably has the upper hand, making it an ideal tool for establishing directional bias.
Multi-timeframe view of market structure provides crucial guidance for analyzing market structure states on any individual timeframe. If higher timeframe market structure is bullish, it doesn't make sense to expect contradicting lower timeframe market structure to provide significant adverse movement, but rather a normal correction within a long term trend. In the same way, if lower timeframe market structure is in agreement with higher timeframe market structure, one can expect a reliable trending environment to ensue as multiple points of confluence are in place.
Bullish structure can be considered constructive on a series of higher highs and higher lows, indicating strong interest from bulls to sustain an uptrend. Vice versa is true for bearish structure, a series of lower highs and lower lows can be considered constructive. When structure does not indicate strong interest to maintain a supportive trend (lower highs on bullish structure, higher lows on bearish structure), a structure shift and a turn in trend might be nearing.
Market structure shifts are of great interest for breakout traders who position for continuation. Structure shifts can indeed be fertile ground for executing a breakout trade, but breakouts can easily turn into fakeouts that leave participants in an awkward position. When price moves further away from the underwater participants, potential for snowball effect of covering positions and driving price further away is elevated.
Liquidity sweeps as a concept is based on the premise that pivoting price is evidence of meaningful depth of liquidity found at/around pivot. If liquidity existed at a pivot once, it is likely to exist there in the future as well. When price grinds against liquidity, it is on a path of resistance rather than path of least resistance. Pivots are also attractive placements for traders to set stop-losses, which act as fuel for price to move to the opposite direction when swept and triggered.
Behind tightly formed pivots are potentially many stop-loss orders lulled in the comfort of having many layers of levels protecting their position. Compression that leaves such clusters of unswept liquidity rarely goes unvisited.
As markets strive for efficient and proper transacting most of the time, imbalances serve as points in price where price is naturally attracted to. However, imbalances too are contextual and sometimes one sided trading is rewarded with follow through, rather than with a fill. Identifying market regimes give further clue into what to expect from imbalances. In a ranging environment, one can expect imbalances to fill relatively quick, making them ideal targets for entries and exits.
On a strongly trending environment on the other hand imbalances tend to stick for a much longer time. In such environments continuation can be expected with no fills or only partial fills. Signs of demand preventing fill attempts serve as additional clues for imminent continuation.

120x ticker screener (composite tickers)In specific circumstances, it is possible to extract data, far above the 40 `request.*()` call limit for 1 single script .
The following technique uses composite tickers . Changing tickers needs to be done in the code itself as will be explained further.
⎯⎯⎯⎯⎯⎯⎯⎯⎯⎯⎯⎯⎯⎯⎯⎯⎯⎯⎯⎯⎯⎯⎯⎯⎯⎯⎯⎯⎯⎯⎯⎯⎯⎯⎯⎯⎯⎯⎯⎯⎯⎯⎯⎯⎯⎯⎯⎯⎯⎯⎯⎯⎯⎯⎯
🔶 PRINCIPLE
Standard example:
c1 = request.security('MTLUSDT' , 'D', close)
This will give the close value from 1 ticker (MTLUSDT); c1 for example is 1.153
Now let's add 2 tickers to MTLUSDT; XMRUSDT and ORNUSDT with, for example, values of 1.153 (I), 143.4 (II) and 0.8242 (III) respectively.
Just adding them up 'MTLUSDT+XMRUSDT+ORNUSDT' would give 145.3772 as a result, which is not something we can use...
Let's multiply ORNUSDT by 100 -> 14340
and multiply MTLUSDT by 1000000000 -> 1153000000 (from now, 10e8 will be used instead of 1000000000)
Then we make the sum.
When we put this in a security call (just the close value) we get:
c1 = request.security('MTLUSDT*10e8+XMRUSDT*100+ORNUSDT', 'D', close)
'MTLUSDT*10e8+XMRUSDT*100+ORNUSDT' -> 1153000000 + 14340 + 0.8242 = 1153014340.8242 (a)
This (a) will be split later on, for example:
1153014330.8242 / 10e8 = 1.1530143408242 -> round -> in this case to 1.153 (I), multiply again by 10e8 -> 1153000000.00 (b)
We subtract this from the initial number:
1153014340.8242 (a)
- 1153000000.0000 (b)
–––––––––––––––––
14340.8242 (c)
Then -> 14340.8242 / 100 = 143.408242 -> round -> 143.4 (II) -> multiply -> 14340.0000 (d)
-> subtract
14340.8242 (c)
- 14340.0000 (d)
––––––––––––
0.8242 (III)
Now we have split the number again into 3 tickers: 1.153 (I), 143.4 (II) and 0.8242 (III)
⎯⎯⎯⎯⎯⎯⎯⎯⎯⎯⎯⎯⎯⎯⎯⎯⎯⎯⎯⎯⎯⎯⎯⎯⎯⎯⎯⎯⎯⎯⎯⎯⎯⎯⎯⎯⎯⎯⎯⎯⎯⎯⎯⎯⎯⎯⎯⎯⎯⎯⎯⎯⎯⎯⎯
In this publication the function compose_3_() will make a composite ticker of 3 tickers, and the split_3_() function will split these 3 tickers again after passing 1 request.security() call.
In this example:
t46 = 'BINANCE:MTLUSDT', n46 = 10e8 , r46 = 3, t47 = 'BINANCE:XMRUSDT', n47 = 10e1, r47 = 1, t48 = 'BINANCE:ORNUSDT', r48 = 4 // T16
•••
T16= compose_3_(t48, t47, n47, t46, n46)
•••
= request.security(T16, res, )
•••
= split_3_(c16, n46, r46, n47, r47, r48)
🔶 CHANGING TICKERS
If you need to change tickers, you only have to change the first part of the script, USER DEFINED TICKERS
Back to our example, at line 26 in the code, you'll find:
t46 = 'BINANCE:MTLUSDT', n46 = 10e8 , r46 = 3, t47 = 'BINANCE:XMRUSDT', n47 = 10e1, r47 = 1, t48 = 'BINANCE:ORNUSDT', r48 = 4 // T16
( t46 , T16 ,... will be explained later)
You need to figure out how much you need to multiply each ticker, and the number for rounding, to get a good result.
In this case:
'BINANCE:MTLUSDT', multiply number = 10e8, round number is 3 (example value 1.153)
'BINANCE:XMRUSDT', multiply number = 10e1, round number is 1 (example value 143.4)
'BINANCE:ORNUSDT', NO multiply number, round number is 4 (example value 0.8242)
The value with most digits after the decimal point by preference is placed to the right side (ORNUSDT)
If you want to change these 3, how would you do so?
First pick your tickers and look for the round values, for example:
'MATICUSDT', example value = 0.5876 -> round -> 4
'LTCUSDT' , example value = 77.47 -> round -> 2
'ARBUSDT' , example value = 1.0231 -> round -> 4
Value with most digits after the decimal point -> MATIC or ARB, let's pick ARB to go on the right side, LTC at the left of ARB, and MATIC at the most left side.
-> 'MATICUSDT', LTCUSDT', ARBUSDT'
Then check with how much 'LTCUSDT' and 'MATICUSDT' needs to be multiplied to get this: 5876 0 7747 0 1.0231
'MATICUSDT' -> 10e10
'LTCUSDT' -> 10e3
Replace:
t46 = 'BINANCE:MTLUSDT', n46 = 10e8 , r46 = 3, t47 = 'BINANCE:XMRUSDT', n47 = 10e1, r47 = 1, t48 = 'BINANCE:ORNUSDT', r48 = 4 // T16
->
t46 = 'BINANCE:MATICUSDT', n46 = 10e10 , r46 = 4, t47 = 'BINANCE:LTCUSDT', n47 = 10e3, r47 = 2, t48 = 'BINANCE:ARBUSDT', r48 = 4 // T16
DO NOT change anything at t46, n46,... if you don't know what you're doing!
Only
• tickers ('BINANCE:MTLUSDT', 'BINANCE:XMRUSDT', 'BINANCE:ORNUSDT', ...),
• multiply numbers (10e8, 10e1, ...) and
• round numbers (3, 1, 4, ...)
should be changed.
There you go!
🔶 LIMITATIONS
🔹 The composite ticker fails when 1 of the 3 isn't in market in the weekend, while the other 2 are.
That is the reason all tickers are crypto. I think it is possible to combine stock,... tickers, but they have to share the same market hours.
🔹 The number cannot be as large as you want, the limit lays around 15-16 digits.
This means when you have for example 123, 45.67 and 0.000000000089, you'll get issues when composing to this:
-> 123045670.000000000089 (21 digits)
Make sure the numbers are close to each other as possible, with 1 zero (or 2) in between:
-> 1.230045670089 (13 digits by doing -> (123 * 10e-3) + (45.67 * 10e-7) + 0.000000000089)
🔹 This script contains examples of calculated values, % change, SMA, RMA and RSI.
These values need to be calculated from HTF close data at current TF (timeframe).
This gives challenges. For example the SMA / %change is not a problem (same values at 1h TF from Daily data).
RMA , RSI is not so easy though...
Daily values are rather similar on a 2-3h TF, but 1h TF and lower is quite different.
At the moment I haven't figured out why, if someone has an idea, don't hesitate to share.
The main goal of this publication is 'composite tickers ~ request.security()' though.
🔹 When a ticker value changes substantially (x10, x100), the multiply number needs to be adjusted accordingly.
🔶 SETTINGS
SHOW SETS
SET
• Length : length of SMA, RMA and RSI
• HTF : Higher TimeFrame (default Daily)
TABLE
• Size table : \ _ Self-explanatory
• Include exchange name : /
• Sort : If exchange names are shown, the exchanges will be sorted first
COLOURS
• CH%
• RSI
• SMA (RMA)
DEBUG
Remember t46 , T16 ,... ?
This can be used for debugging/checking
ALWAYS DISABLE " sort " when doing so.
Example:
Set string -> T1 (tickers FIL, CAKE, SOL)
(Numbers are slightly different due to time passing by between screen captures)
Placing your tickers at the side panel makes it easy to compare with the printed label below the table (right side, 332201415014.45 ),
together with the line T1 in the script:
t1 = 'BINANCE:FILUSDT' , n1 = 10e10, r1 = 4, t2 = 'BINANCE:CAKEUSDT' , n2 = 10e5 , r2 = 3, t3 = 'BINANCE:SOLUSDT' , r3 = 2 // T1
FIL : 3.322
CAKE: 1.415
SOL : 14.56
Now it is easy to check whether the tickers are placed close enough to each other, with 1-2 zero's in between.
If you want to check a specific ticker, use " Show Ticker" , see out initial example:
Set string -> T16
Show ticker -> 46 (in the code -> t46 = 'BINANCE:MTLUSDT')
(Set at 0 to disable " check string " and NONE to disable " Set string ")
-> Debug/check/set away! 😀
🔶 OTHER TECHNIQUES
• REGEX ( Regular expression ) and str.match() is used to delete the exchange name from the ticker, in other words, everything before ":" is deleted by following regex:
exch(t) => incl_exch ? t : str.match(t, "(?<=:) +")
• To sort, array.sort_indices() is used (line 675 in the code), just as in my first "sort" publication Sort array alphabetically - educational
aSort = arrT.copy()
sort_Indices = array.sort_indices(id= aSort, order= order.ascending)
• Numbers and text colour will adjust automatically when switching between light/dark mode by using chart.fg_color / chart.bg_color
🔹 DISCLAIMER
Please don't ask me for custom screeners, thank you.

Cauchy Distribution Oscillator by c00l75ITALIANO: Questo script è un indicatore che non viene sovrapposto al grafico dei prezzi. Utilizza una finestra di lookback di 14 periodi (che può essere modificata dall’utente) per calcolare la distribuzione di Cauchy per ogni periodo.
La distribuzione di Cauchy è una distribuzione di probabilità continua che viene utilizzata in statistica. Ha una forma simile a quella della distribuzione normale, ma con code più pesanti. Questo significa che ha una maggiore probabilità di generare valori estremi rispetto alla distribuzione normale. E' una distribuzione di probabilità che descrive nel piano euclideo l'intersezione tra l'asse delle ascisse ed una retta passante per un punto fissato ed inclinata ad un angolo che segue la distribuzione continua uniforme.
Nello script, viene utilizzata una funzione che calcola il valore della distribuzione di Cauchy per un dato valore x, utilizzando altre 2 variabili per le quali ho impostato un valore fisso. Il risultato viene quindi memorizzato in un array e la media viene calcolata per tutti i valori nell’array.
E' un oscillatore un po' "estremo", che misura il momentum del prezzo in maniera decisa e per tanto, secondo la mia opinione, va utilizzato di concerto con altri indicatori per poter prendere decisioni consapevoli.
Ad ogni modo se vi piace mettete un "boost" e lasciate un commento se volete altre funzioni o modifiche su questo script.
ENGLISH: This script is an indicator that is not overlaid on the price chart. It uses a 14-period lookback window (which can be modified by the user) to calculate the Cauchy distribution for each period.
The Cauchy distribution is a continuous probability distribution that is used in statistics. It has a similar shape to the normal distribution, but with heavier tails. This means that it has a higher probability of generating extreme values than the normal distribution. It is a probability distribution that describes in the Euclidean plane the intersection of the x-axis and a line passing through a fixed point and inclined at an angle that follows the uniform continuous distribution.
In the script, a function is used that calculates the value of the Cauchy distribution for a given x value, using 2 other variables for which I set a fixed value. The result is then stored in an array and the mean is calculated for all the values in the array.
It is a somewhat "extreme" oscillator, measuring price momentum in a decisive way and therefore, in my opinion, should be used in concert with other indicators in order to make informed decisions.
Anyway if you like it put a "boost" and leave a comment if you want other functions or modifications on this script.

Multiple Moving Average ToolkitFeatures Overview:
Multiple Moving Averages: The script allows you to plot up to five different Moving Averages (MAs) on your chart at the same time. You can choose the type of MA (EMA, SMA, HMA, WMA, DEMA, VWMA, VWAP) and the length of each one.
Color Ribbon: You can turn the MAs into a color ribbon by selecting the "Turn into Color Ribbon?" option. This will make the area between the MAs colored and can help you identify trends more easily.
MA Value Table: You can draw a table on your chart that displays the current values of each MA, whether the trend is bullish or bearish along with the length of the MAs. The current ATR value is also shown in the last cell of the table. You can choose the location of the table (Top Left, Top Right, Bottom Left, Bottom Right) and the transparency of the background color.
Crosses: The script can detect when two MAs cross over each other (1st MA crosses 5th MA and vice versa), indicating a potential trend reversal. It will plot crosses on the chart at the point of the crossover and give an alert if the "Bullish Cross Detected" or "Bearish Cross Detected" condition is met.
How to use:
Once the script is added to your chart, you can customize the settings to fit your preferences. You can choose the type and length of each MA, whether to turn them into a color ribbon, whether to plot crosses, and whether to draw the MA Value Table.
The MA Value Table can be moved to a different location on the chart by selecting the "Location of Table" option and choosing Top Left, Top Right, Bottom Left, or Bottom Right.
Watch for MA crossovers and alerts to identify potential trend reversals. The script can help you identify bullish and bearish trends by color-coding the area between the MAs and displaying the current values of each MA in the table.
Breakdown of the script:
User Inputs
The first section of the script defines several user inputs that allows you to customize the indicator. These include options for turning the MAs into a color ribbon, plotting crosses when there is a bullish or bearish cross of the MAs, drawing a table of the MA values, and setting the transparency of the ribbon. You can also select the location of the MA value table and customize the settings for each individual MA.
Moving Average Calculation
The script defines a function called "getMA" that calculates the moving average for a given type and length. The function uses a switch statement to determine which type of moving average to use, such as an exponential moving average (EMA), simple moving average (SMA), Hull moving average (HMA), weighted moving average (WMA), double exponential moving average (DEMA), volume-weighted moving average (VWMA), or volume-weighted average price (VWAP).
The script then calls this function to calculate the values of up to five different MAs, depending on the user input. The ATR (average true range) is also calculated using the TA library.
Color Filter and Cross Detection
The script sets a color filter based on the relationship between the MAs. If the shorter-term MAs are above the longer-term MAs, the filter is set to green to indicate a bullish trend, and if the shorter-term MAs are below the longer-term MAs, the filter is set to red to indicate a bearish trend. You can adjust the transparency of the ribbon to make it more or less visible.
The script also detects when there is a bullish or bearish cross of the MAs and can generate alerts to notify you.
MA Plotting
The script plots up to five MAs on the chart, depending on the user input. The MAs are plotted as lines with different colors and thicknesses, and you can choose to turn them into a color ribbon if desired.
Cross Plotting
The script plots crosses on the chart when there is a bullish or bearish cross of the MAs. The crosses are plotted as X shapes at the location of the cross and are color-coded to indicate the direction of the cross.
MA Value Table
Finally, the script draws a table of the MA values on the chart, displaying the values of each MA as well as the current trend and the ATR. You can customize the location of the table, and the table is colored to match the color filter of the MAs.
Feel free to message me or comment on the post with any questions or issues!
Much more to come!
Thanks for reading, enjoy!

DeQuex Algo V2The DeQuex Algo V2 script is an advanced technical analysis tool that provides traders with a powerful set of features to help them identify potential trading opportunities in the market. The script is based on the widely used Moving Average Convergence Divergence (MACD) indicator, which is known for its ability to identify changes in trend direction.
The script has several input parameters that can be customized to meet the specific needs of each trader. This flexibility makes it a great tool for traders of all skill levels, from beginners to advanced traders. By adjusting the input parameters, traders can fine-tune the script to their preferred trading style and risk tolerance.
One of the key features of the DeQuex Algo V2 script is its ability to generate buy and sell signals based on MACD crosses. These signals are generated when the MACD line crosses above or below the signal line, indicating a potential change in trend direction. The script also includes options to display trend signals, which can be helpful in identifying the strength of the current trend.
In addition to the MACD indicator, the script also includes a dynamic support and resistance level calculation based on the basis and deviation of the price, as well as volume trend analysis using On Balance Volume (OBV). These features can be used to identify key levels of support and resistance, as well as determine the overall trend direction of the market. This information can be used to make more informed trading decisions and improve the chances of success in the market.
Overall, this script is powerful tool that can be used to help traders identify potential trading opportunities in the market. By using this script in conjunction with other technical analysis tools and fundamental analysis, traders can make more informed trading decisions and increase their chances of success.
Here are the main features of the script:
Moving Average Convergence Divergence (MACD) indicator: The script is based on the MACD indicator, which is widely used by traders to identify changes in trend direction. The script generates buy and sell signals based on MACD crosses, indicating potential changes in trend direction.
Customizable input parameters: The script has several input parameters that can be customized to meet the specific needs of each trader. This includes the sensitivity of the MACD indicator, the source of the price data, the smoothing period, the type of moving average to use, and the display options for trend signals and price bars.
Trend signals: The script includes options to display trend signals, which can be helpful in identifying the strength of the current trend. This can help traders determine whether to enter a trade or wait for a better opportunity.
Dynamic support and resistance levels: The script includes a dynamic support and resistance level calculation based on the basis and deviation of the price. This can help traders identify key levels of support and resistance, which can be used to determine potential entry and exit points.
Volume trend analysis: The script uses On Balance Volume (OBV) to determine the volume trend in the market. This can be used to identify potential changes in trend direction and to confirm the strength of the current trend.
Alert system: The script includes an alert system that can notify traders when a buy or sell signal is generated. This can be helpful for traders who are not able to monitor the market at all times.
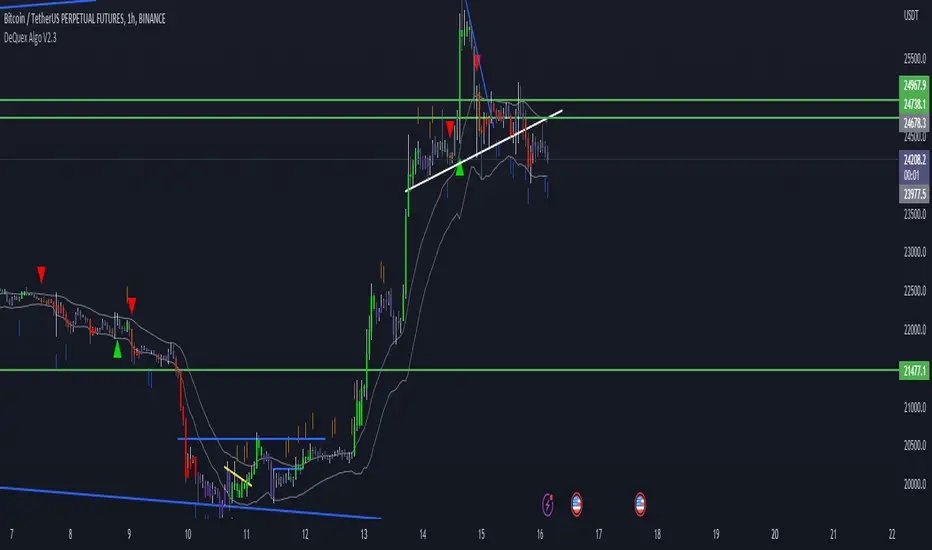
Parabolic Scalp Take Profit[ChartPrime]Indicators can be a great way to signal when the optimal time is for taking profits. However, many indicators are lagging in nature and will get market participants out of their trades at less than optimal price points. This take profit indicator uses the concept of slope and exponential gain to calculate when the optimal time is to take profits on your trades, thus making this a leading indicator.
Usage:
In essence the indicator will draw a parabolic line that starts from the market participants entry point and exponentially grows the slope of the line eventually intersecting with the price action. When price intersects with the parabolic line a take profit signal will appear in the form of an x. We have found that this take profit indicator is especially useful for scalp trades on lower timeframes.
How To Use:
Add the indicator to the chart. Click on the candle which the trade is on. Click on either the price which the trade will be at, or at the bottom of the candle in a long, or the top of a candle in a short. Select long or short. Open the settings of the indicator and adjust the aggressiveness to the desired value.
Settings:
- Start Time -- This is the bar in which your entry will be at, or occured at and the script will ask you to click on the bar with your mouse upon first adding the script.
- Start Price -- This is the price in which the entry will be at, or was at and the script will ask you to click on the price with your mouse upon first adding the script.
- Long/Short -- This is a setting which lets the script know if it is a long or a short trade, and the script will ask you to confirm this upon first adding it to the chart.
- Aggressiveness -- This directly affects how aggressive the exponential curve is. A value of 101 is the lowest possible setting, indicating a very non-aggressive exponential buildup. A value of 200 is the highest and most aggressive setting, indicating a doubling effect per bar on the slope.

Bollinger Bands SignalsDescription:
This indicator works well in trendy markets on long runs and in mean-reverting markets, at almost any timeframe.
That said, higher timeframes are much preferred for their intrinsic ability to cut out noise. The example chart is in 3H TF.
Be mindful, the script shows somewhat erratic jigsaw-like behaviour during consolidation periods when the price
jumps up and down in indecision which way to go. Fortunately, there are scripts out there that detect such periods.
You can choose between 4 Moving Averages, Vidya being the default. Period, Deviation and Bands Width parameters
all of them affect the signal generation.
For the Pine Script coder this script is pretty obvious.
It uses a standard technical analysis indicator - Bollinger Bands - and appends it with a 'width' parameter and
a signal generation procedure.
The signal generation procedure is the heart of this script that keeps the script pumping signals.
The BB width is used as a filter.
You can use this procedure in your own scripts and it will continue generate signals according to your rules.

Kyushu LegsKyushu Legs is a trend change detector proposed by Goichi Hosoda, a famous Japan journalist, creator of Ichimoku trading theory.
In its core idea it compares current data to the data from 9 weeks back in order to show long running trend and detect trend change moments.
This is a basic version of Kyushu Legs script. If you are looking for more features, please check PRO version of this script.
If after reading script description something is not clear, do not hesitate to ask. We are helping all users.
Script Settings:
| KYUSHU |
Legs - Check box turning on/off Kyushu Legs visualization
Length - Period length, 9 by default.
Candle body color up and down
Formations, TRend, Alerts - Information about formations feature, trend visualization feature, alerts feature
Troubleshooting:
In case of any problems, send error details to the author of the script.
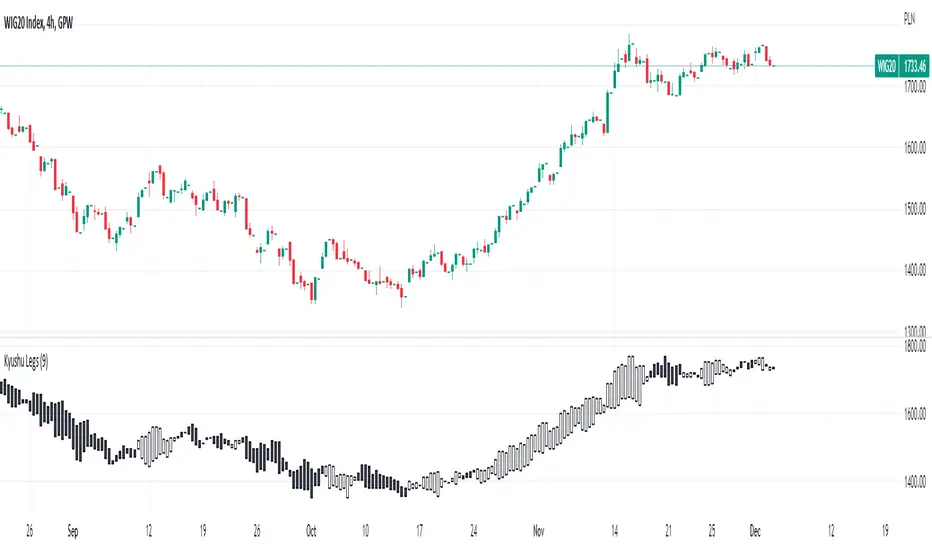
Gann Box by time frame
█ OVERVIEW
This script is designed to plot Gann boxes within a specific time frame candle. That means, you can get your intraday Gann box with one click and zoom in to low time frame. Highs and lows are set by candle chosen, you can display the yearly Gann box if that's something you want to view!
In addition, this script can highlight the golden ratio and its inverse ( .618 & .382 ) within the box itself. You have the option to select between a daily, a weekly, or a monthly candle. Not to mention that you have the ability to select a multiplier to those candles, where for example, you would be able to plot the 3 month ( quarterly ) gann box. or the yearly by selecting 12 months! This script includes zero, one and two divisions to Gann box. The first division would get you the sun lines only. while the first division has the middle 0.5 point and so on. This script is meant to be used as a one-click fast solution. Highs and lows get adjusted as the chart breaks those levels automatically.
█ Future Plans and upgrades to this script may include :
1. Adding more divisions.
2. Data box that shows box stats and performance.
3. More geometrical features such as the spirals and the circles on demand by one click.
and more! feel free to let me know what you'd like to see!
█ How to use :
1. Put the script on your chart
2. Navigate to the settings
3. Select your box's time frame.
give the script a few seconds and you should be set.
This script is coded as an addon to the Gann ToolBox package/scripts.

Percent Levels From Previous CloseThis indicator plots on the chart +/- 1% / 2% / 3% ranges based on the previous day's close levels.
Disclaimer :
Success in trading is all about following your trading strategy and indicators should fit into your own strategy, and not be traded purely on.
This script is for informational and educational purposes only. Use of the script does not constitute professional and / or financial advice. You are solely responsible for evaluating the outcome of the script and the risks associated with using the script. In exchange for the use of the script, you agree not to hold monpotejulien TradingView user responsible for any possible claims for damages arising out of any decisions you make based on the use of the script.
Regression Channel with projectionEXPERIMENTAL:
Auto adjusting regressive channel with projection.
Linear regression is a linear approach to modeling the relationship between a dependent variable and one or more independent variables.
In linear regression , the relationships are modeled using linear predictor functions whose unknown model parameters are estimated from the data.
Disclaimer :
Success in trading is all about following your trading strategy and indicators should fit into your own strategy, and not be traded purely on.
This script is for informational and educational purposes only. Use of the script does not constitute professional and / or financial advice. You are solely responsible for evaluating the outcome of the script and the risks associated with using the script. In exchange for the use of the script, you agree not to hold monpotejulien TradingView user responsible for any possible claims for damages arising out of any decisions you make based on the use of the script.
ZigZag Channel with projection forecastThis indicator is created on top of existing Zigzag indicator .
The projection channel starts at the end of the last ZigZag line.
Disclaimer
Success in trading is all about following your trading strategy and indicators should fit into your own strategy, and not be traded purely on.
This script is for informational and educational purposes only. Use of the script does not constitute professional and / or financial advice. You are solely responsible for evaluating the outcome of the script and the risks associated with using the script. In exchange for the use of the script, you agree not to hold monpotejulien TradingView user responsible for any possible claims for damages arising out of any decisions you make based on the use of the script.

EMA channel with projection forecastExponential Moving Average Channel with projection forecast.
Riding a bull run is almost always riding an EMA value.
This indicator plots displaced EMA values guggesting possible sell targets.
Disclaimer
Success in trading is all about following your trading strategy and indicators should fit into your own strategy, and not be traded purely on.
This script is for informational and educational purposes only. Use of the script does not constitute professional and / or financial advice. You are solely responsible for evaluating the outcome of the script and the risks associated with using the script. In exchange for the use of the script, you agree not to hold monpotejulien TradingView user responsible for any possible claims for damages arising out of any decisions you make based on the use of the script.